Everybody has concerns and fears about what is going on in Fukushima, not because we know the worst scenario may come true, but because we have no idea what the worst scenario is going to be like. We all are at a loss between unclear government's words and massive media hype.
This page is intended to provide decent information to people in Tokyo, especially foreigners who are left uninformed / misinformed about what's going on and what's the latest status. No intention to give you optimistic/pessimistic view. Please make your own decision based on your own thinking. I just want each of you to stay cool knowing that you can reach to the fact if necessary.
This page is to give you a big picture of the latest status in terms of radioactive levels.
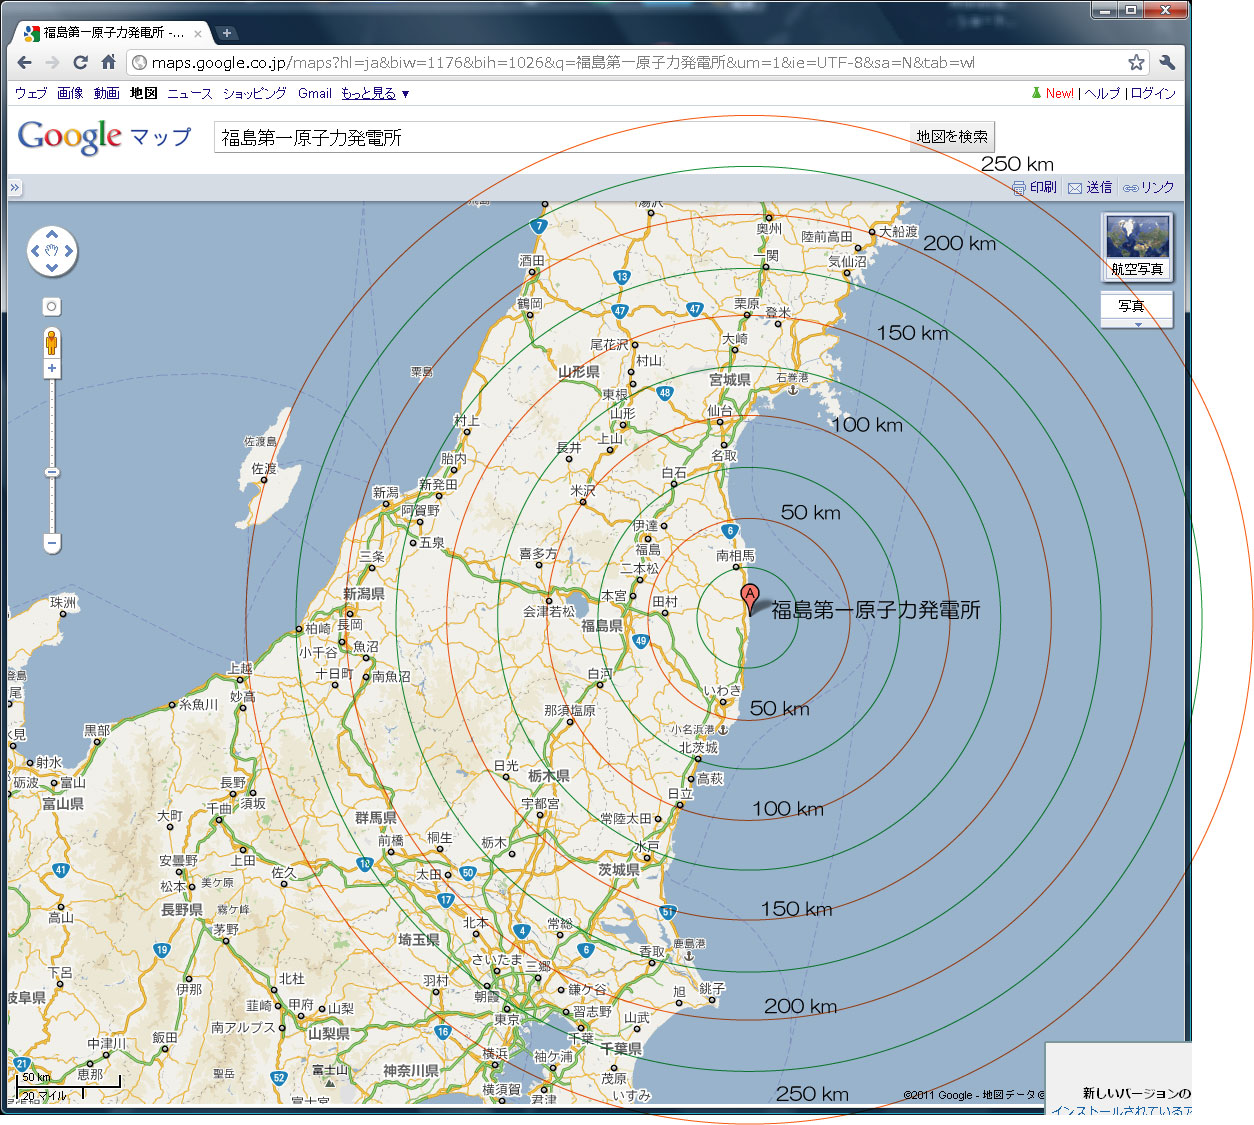
<How far you are>
This s a map roughly indicates the distance from the plants in question.
If you live in Tokyo, you are about 200-250km away from the plants.
http://4.bp.blogspot.com/-Rs5XPVkAC2U/TXuOqCs-L6I/AAAAAAAAAJc/rUv3jrrgVJ4/s1600/9dd863d106538b8d.jpg
<The radiation level around Tokyo at the moment>
Here's the list of the monitors that you can check:
http://www.houshasen-pref-ibaraki.jp/present/result01.html
http://www.city.yokohama.lg.jp/kankyo/saigai/
http://park18.wakwak.com/~weather/geiger_index.html
* There's a note saying: "a few minutes before 9 am on 17th Mar, unusual spike was observed. This is because my computer had been temporality overloaded for 14 minutes, and recorded the accumulated data after 14 mins of temporal freeze. The average level should be: 142 counts / 14 mins = 10.14 cpm/min (normal level). Sorry for any confusion if caused"
http://www.bousai.ne.jp/vis/index.php
http://www.tohoku-epco.co.jp/electr/genshi/onagawa/mp.html
* By the way, 1,000nGy ~ 1,000 nSv = 1 micro Sv (thanks Dan for pointing out)
In accurate definition, 1 SV = 1 * N * Q * Gy = (approx) 1 * Gy
N = 1 for Human (could be lower, depending on the organ)
Q = 1 for gamma-ray that are considered as the principal immediate threat for now. (could be higher for other types of ray)
Source: http://en.wikipedia.org/wiki/Sievert
<How it possibly changes in the near future>
It is considered that the radiation level in outside of Fukushima is largely affected by:
1. The source: release of radioactive materials from the Fukushima Plants
2. Aerodynamics: the wind direction
1. Radioactives from Fukushima Plants
Vapor including a little amount of radioactive materials has been and scheduled to released for several times - but you never know how much radioactive materials are released in the environment. The best possible thing we can do is again, to assess the radiation level around the Fukushima Plants. We have to rely on the TEPCO monitors on this.
The latest issues (as of 6:00 am, Mar 14) from Fukushima I (Daiichi)
http://www.tepco.co.jp/cc/press/betu11_j/images/110314e.pdf
The latest issues (as of 8:00 am, Mar 14) from Fukushima II (Daini)
http://www.tepco.co.jp/cc/press/betu11_j/images/110314f.pdf
The 3rd columns explains where it was monitored from MP-1 to MP-8, and 正門 (main gate), and the 4th one is the Gamma-ray strength, 5th is neutron ray strength, the rest is about local wind. As for Fukushima II, only MP-4 is available.
These data is updated on the press release page on TEPCO site (only in Japanese)
http://www.tepco.co.jp/cc/press/index11-j.html
2. Wind direction and
velocity
Again, there are missing data in the tohoku area due to the quake.
South Tohoku (centered around Fukushima)
http://www.jma.go.jp/jp/amedas/205.html?elementCode=1
Kanto (Greater Tokyo Area)
http://www.jma.go.jp/jp/amedas/206.html?elementCode=1
Wind direciton at the 700hPa & 850hPa Sphare (roughly about 3,000 & 1,500m above sea level, respectively)
http://n-kishou.com/ee/exp/exp01.html?cd=aupq78&cat=e1
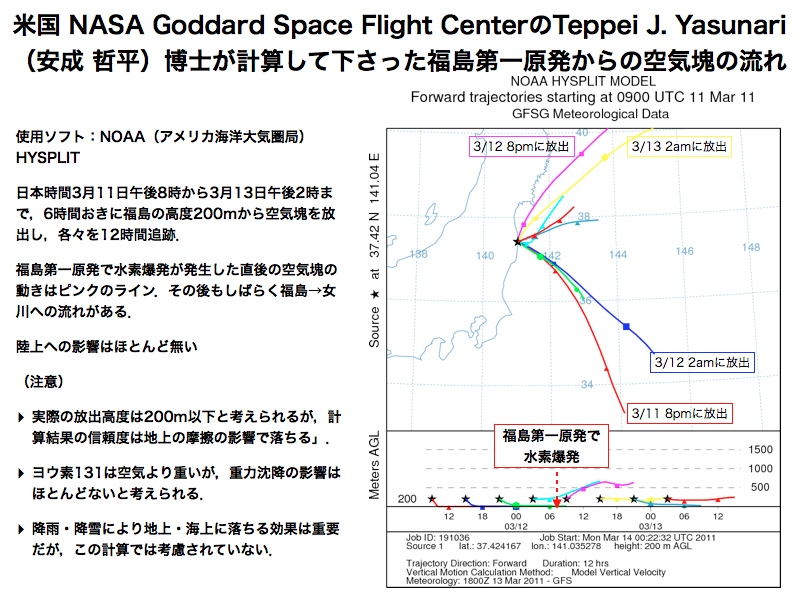
Simulated wind effect by German Newspaper
http://www.spiegel.de/wissenschaft/natur/bild-750835-191816.html
I put here as many sources as I can so as that you can cross-check. I don't think the government or TEPCO bias on the fact itself, but I agree there are suspicions and skepticism about their transparency and diligence when it comes to negative facts.
